plot_qc_tree() visualizes the filtering summary as a treemap. Ion
status (see qc_summary()) is reported here as percentage of all
pre-filtered ions.
Examples
data <- import_data(
example_path("coculture_peak_table.csv"),
example_path("metadata.csv"),
format = "Progenesis"
)
data_filter <- filter_mispicked_ions(data,
ringwin = 0.5,
isowin = 0.01,
trwin = 0.005,
max_iso_shift = 3,
merge_peaks = TRUE
)
#> ℹ Checking 1303 peaks for mispicked peaks.
#> ℹ Argument merge_peaks is: TRUE. Merging mispicked peaks with method sum.
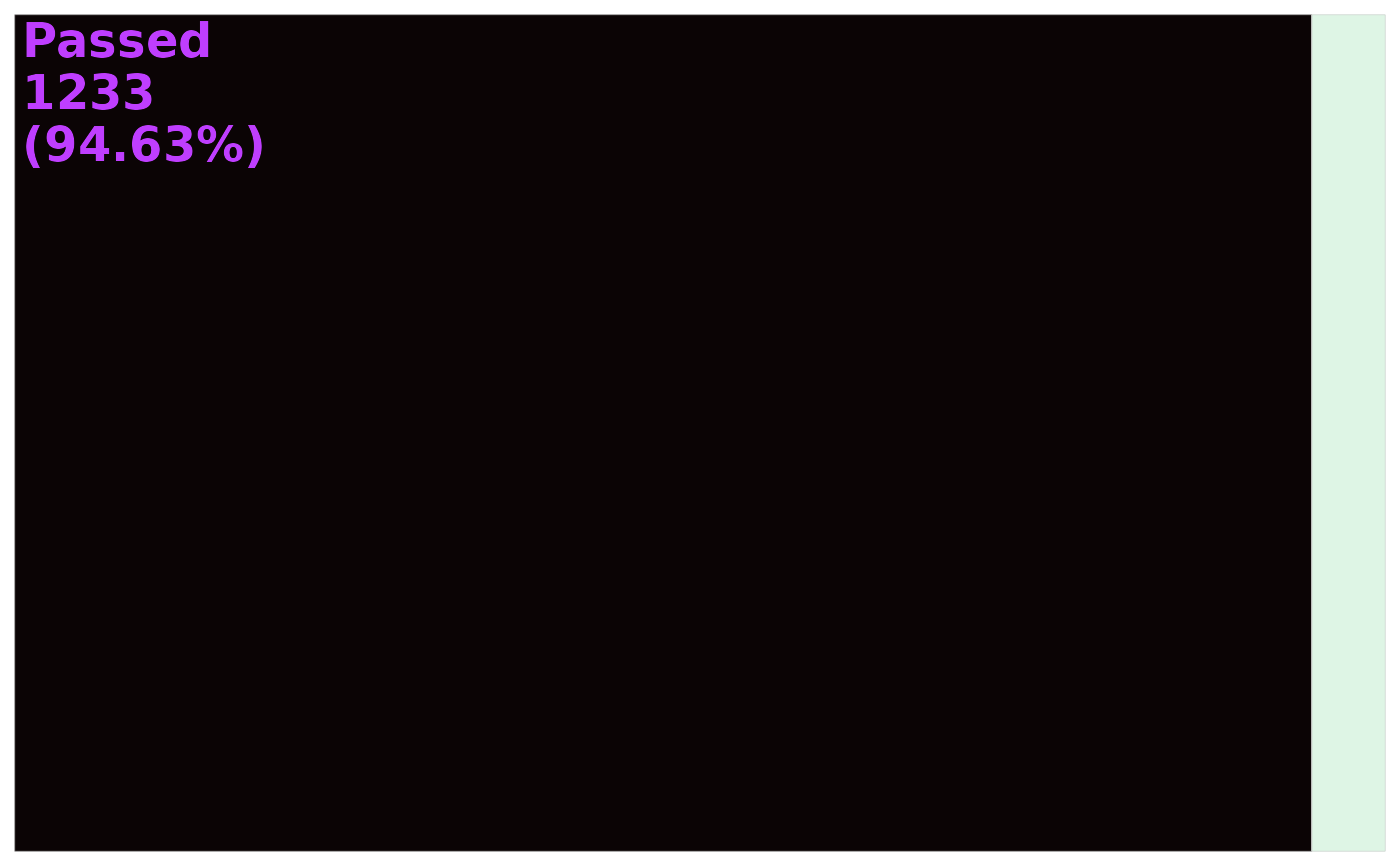
#> ✔ 70 ions failed the mispicked filter, 1233 ions remain.
plot_qc_tree(data_filter)